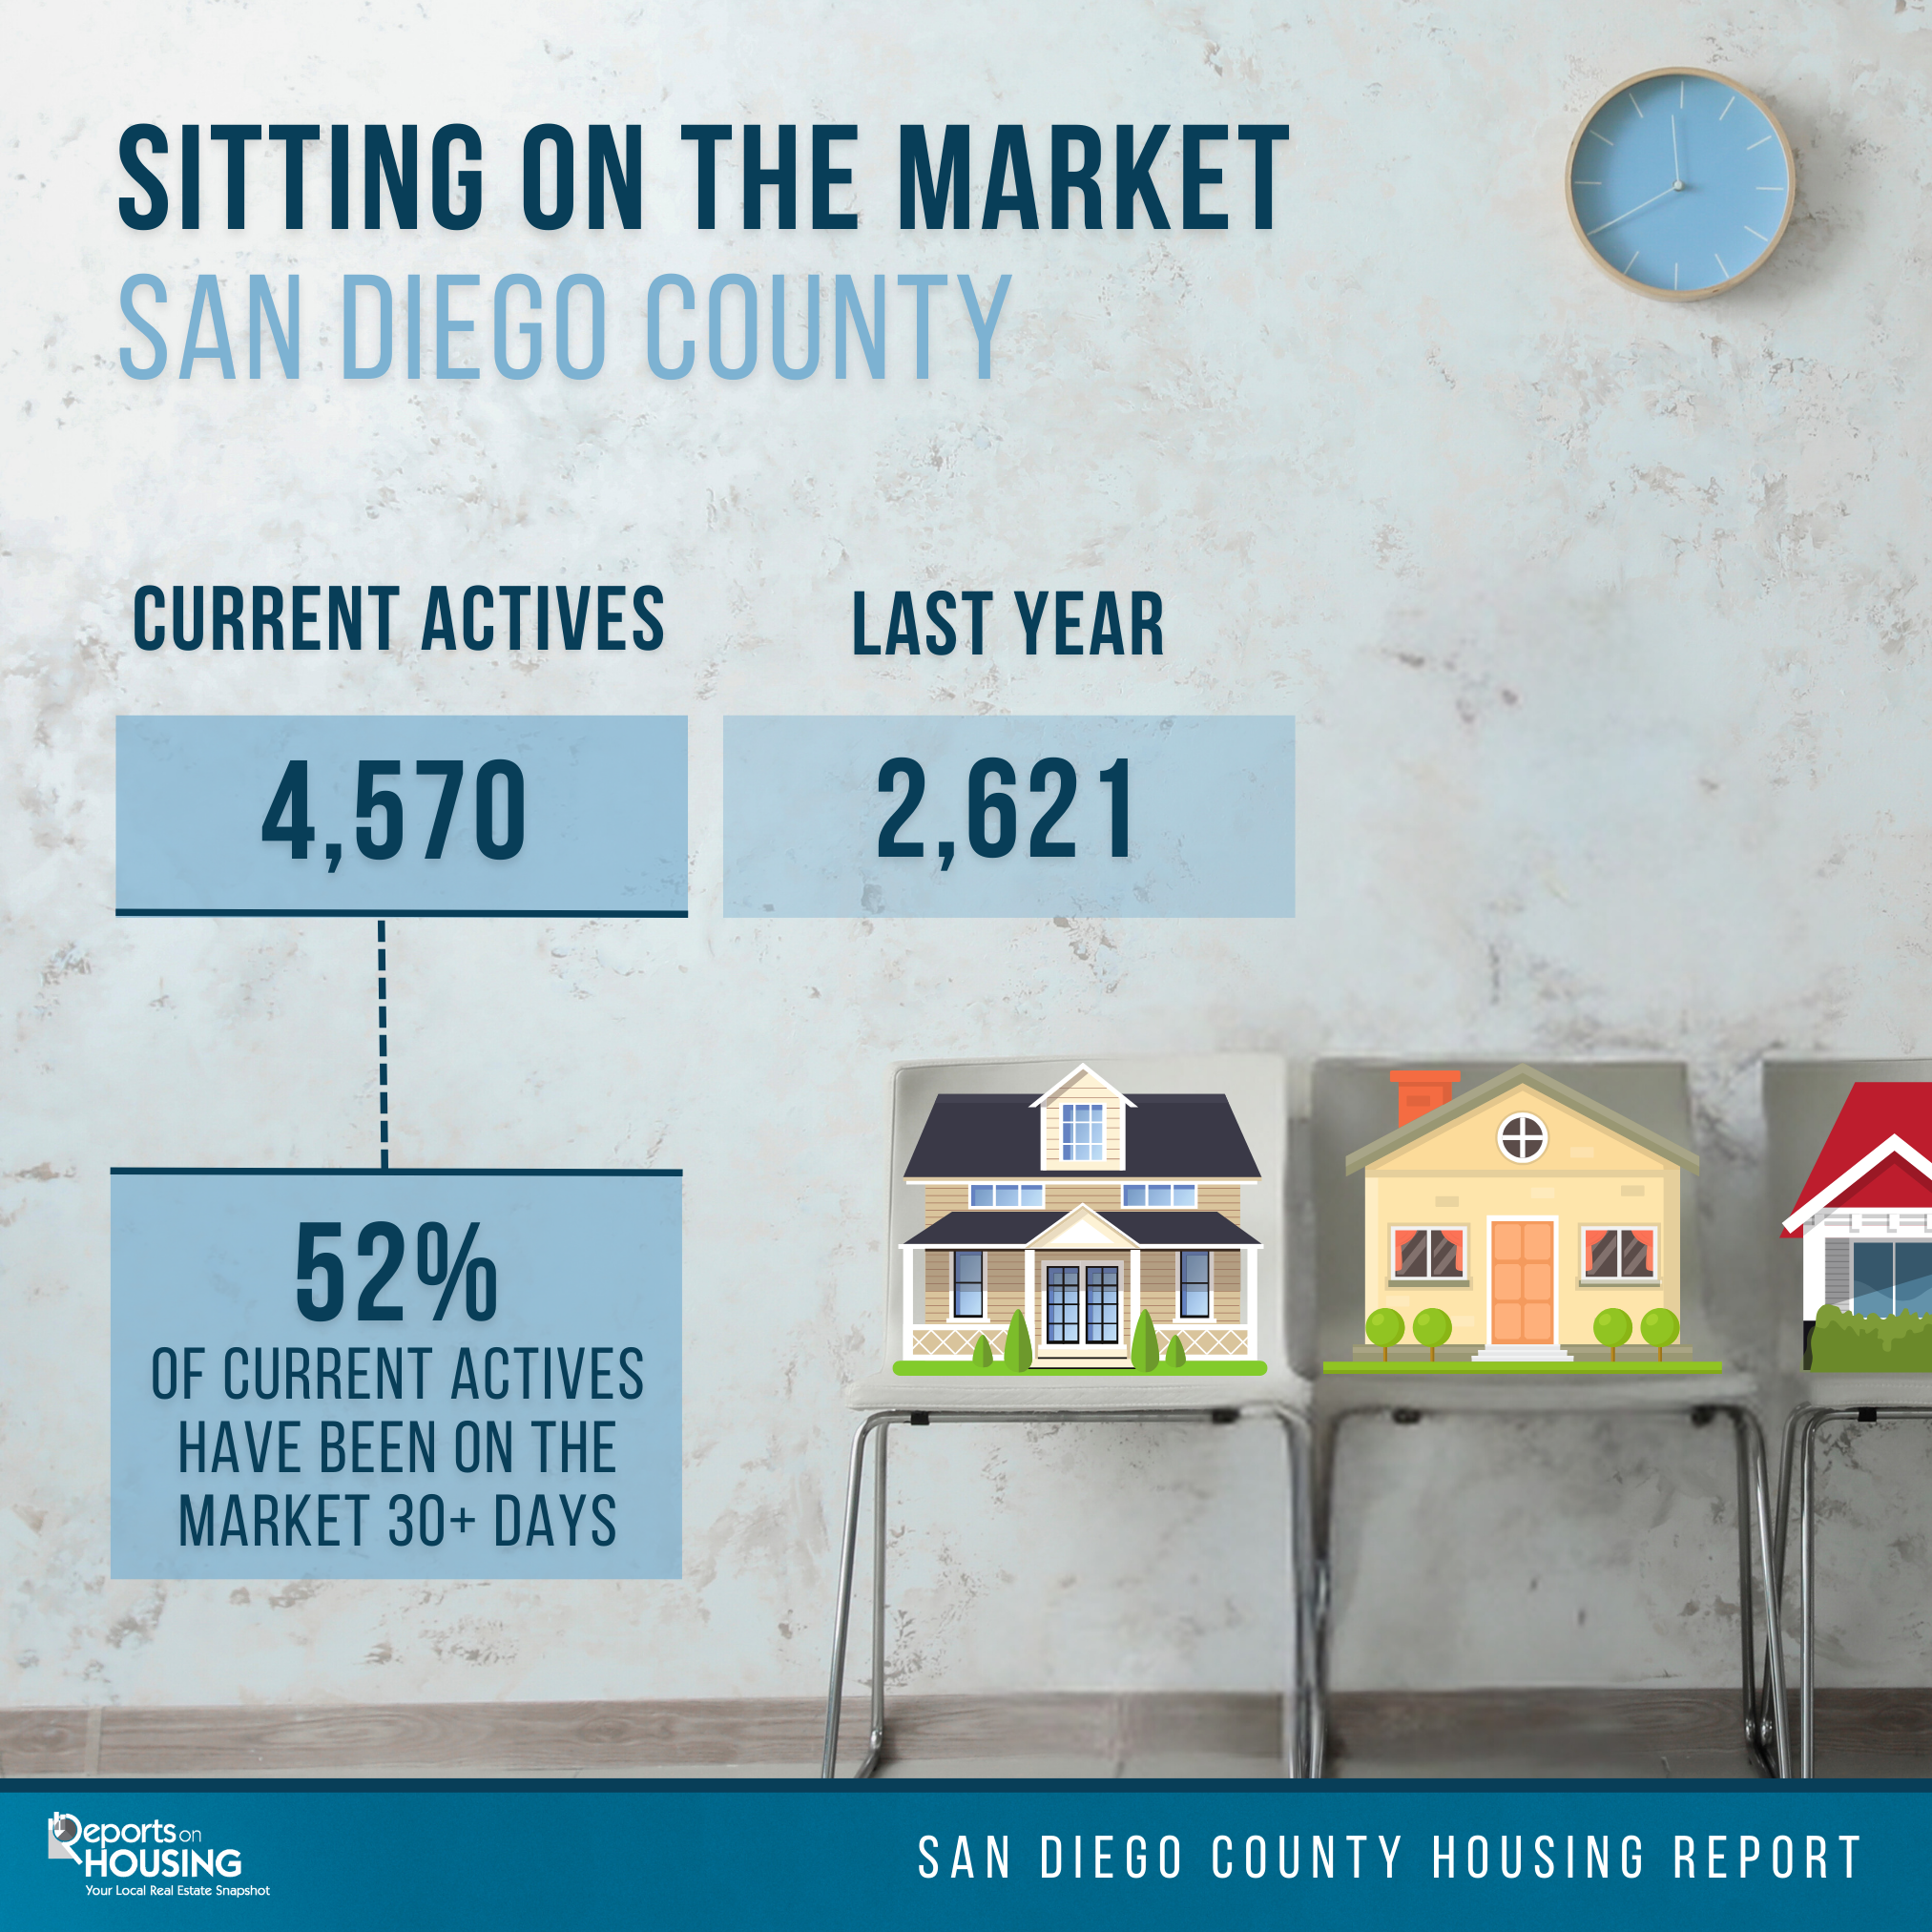
More San Diego Homes are lingering on the market
George Lorimer
Wednesday, August 21, 2024

San Diego County Housing Summary
Click here to request a complete report.
- The active listing inventory increased by 111 homes, up 2%, in the past couple of weeks and now stands at 4,570. In July, 33% fewer homes came on the market compared to the 3-year average before COVID (2017 to 2019), 1,651 fewer. Yet, 705 more sellers came on the market this July compared to July 2023. Last year, there were 2,621 homes on the market, 1,949 fewer homes, or 43% less. The 3-year average before COVID (2017 to 2019) was 7,183, or 57% extra, much higher.
- Demand, the number of pending sales over the prior month, increased by 70 pending sales in the past two weeks, up 4%, and now totals 1,871, its largest rise since May. Last year, there were 1,730 pending sales, 141 fewer or 8% less, the largest difference year-over-year. The 3-year average before COVID (2017 to 2019) was 3,174, or 70% more.
- With demand increasing faster than supply, the Expected Market Time (the number of days it takes to sell all San Diego County listings at the current buying pace) decreased from 74 to 73 days in the past couple of weeks. Last year, it was 45 days, much faster than today. The 3-year average before COVID was 68 days, similar to today.
- In the past two weeks, the Expected Market Time for homes priced below $750,000 increased from 63 to 66 days. This range represents 28% of the active inventory and 31% of demand.
- The Expected Market Time for homes priced between $750,000 and $1 million decreased from 56 to 55 days. This range represents 22% of the active inventory and 30% of demand.
What's your home worth?
- The Expected Market Time for homes priced between $1 million and $1.25 million increased from 68 to 70 days. This range represents 11% of the active inventory and 11% of demand.
- The Expected Market Time for homes priced between $1.25 million and $1.5 million decreased from 79 to 72 days. This range represents 10% of the active inventory and 10% of demand.
- The Expected Market Time for homes priced between $1.5 million and $2 million increased from 87 to 99 days. This range represents 10% of the active inventory and 8% of demand.
- In the past two weeks, the Expected Market Time for homes priced between $2 million and $4 million decreased from 122 to 102 days. The Expected Market Time for homes priced between $4 million and $6 million decreased from 288 to 246 days. The Expected Market Time for homes priced above $6 million increased from 405 to 420 days.
- The luxury end, all homes above $2 million, account for 19% of the inventory and 10% of demand.
- Distressed homes, both short sales and foreclosures combined, comprised only 0.4% of all listings and 0.4% of demand. Only seven foreclosures and nine short sales are available today in San Diego County, with 16 total distressed homes on the active market, up five from two weeks ago. Last year, ten distressed homes were on the market, similar to today.
- There were 2,219 closed residential resales in July, up 9% from July 2023’s 2,037 closed sales. July marked an 11% increase compared to June 2024. The sales-to-list price ratio was 99.1% for all of San Diego County. Foreclosures accounted for only 0.1% of all closed sales, and short sales accounted for 0.2% of all closed sales. That means that 99.7% of all sales were good ol’ fashioned sellers with equity.
Copyright 2024 - Steven Thomas, Reports On Housing - All Rights Reserved. This report may not be reproduced in whole or part without express written permission by the author. Our license allows us to share the complete 12 page report with customers who are not licensed and not real estate affiliates. George Lorimer
We would like to hear from you! If you have any questions, please do not hesitate to contact us. We are always looking forward to hearing from you! We will do our best to reply to you within 24 hours !
