Call/Text George Lorimer at 619-846-1244
San Diego County Housing Summary
What's your home worth today?
- The active listing inventory decreased by 97 homes, down 2%, in the past couple of weeks and now stands at 4,558. For October, 3,078 new sellers entered the market in San Diego County, 1,237 fewer than the 3-year average before COVID (2017 to 2019), 29% less. Last October, there were 2,471 new sellers, 20% fewer than this year. Last year, there were 2,997 homes on the market, 1,561 fewer homes, or 34% less. The 3-year average before COVID (2017 to 2019) was 6,271, or 38% extra, much higher.
- Demand, the number of pending sales over the prior month, remained unchanged at 1,605 in the past couple of weeks. Last year, there were 1,338 pending sales, 267 fewer or 17% less. The 3-year average before COVID (2017 to 2019) was 2,533, or 58% more.
- With supply falling and demand unchanged, the Expected Market Time (the number of days it takes to sell all San Diego County listings at the current buying pace) decreased from 87 to 85 days in the past couple of weeks. Last year, it was 67 days, much faster than today. The 3-year average before COVID was 76 days, also faster than today.
- In the past two weeks, the Expected Market Time for homes priced below $750,000 increased from 76 to 78 days. This range represents 32% of the active inventory and 34% of demand.
- The Expected Market Time for homes priced between $750,000 and $1 million increased from 67 to 68 days. This range represents 22% of the active inventory and 27% of demand.
- The Expected Market Time for homes priced between $1 million and $1.25 million remained at 82 days. This range represents 10% of the active inventory and 11% of demand.
- The Expected Market Time for homes priced between $1.25 million and $1.5 million remained at 87 days. This range represents 9% of the active inventory and 9% of demand.
- The Expected Market Time for homes priced between $1.5 million and $2 million decreased from 119 to 96 days. This range represents 9% of the active inventory and 8% of demand.
- In the past two weeks, the Expected Market Time for homes priced between $2 million and $4 million decreased from 153 to 120 days. The Expected Market Time for homes priced between $4 million and $6 million decreased from 176 to 162 days. The Expected Market Time for homes priced above $6 million decreased from 750 to 527 days.
- The luxury end, all homes above $2 million, account for 18% of the inventory and 10% of demand.
- Distressed homes, both short sales and foreclosures combined, comprised only 0.4% of all listings and 0.4% of demand. Only nine foreclosures and eight short sales are available today in San Diego County, with 17 total distressed homes on the active market, down one from two weeks ago. Last year, 19 distressed homes were on the market, similar to today.
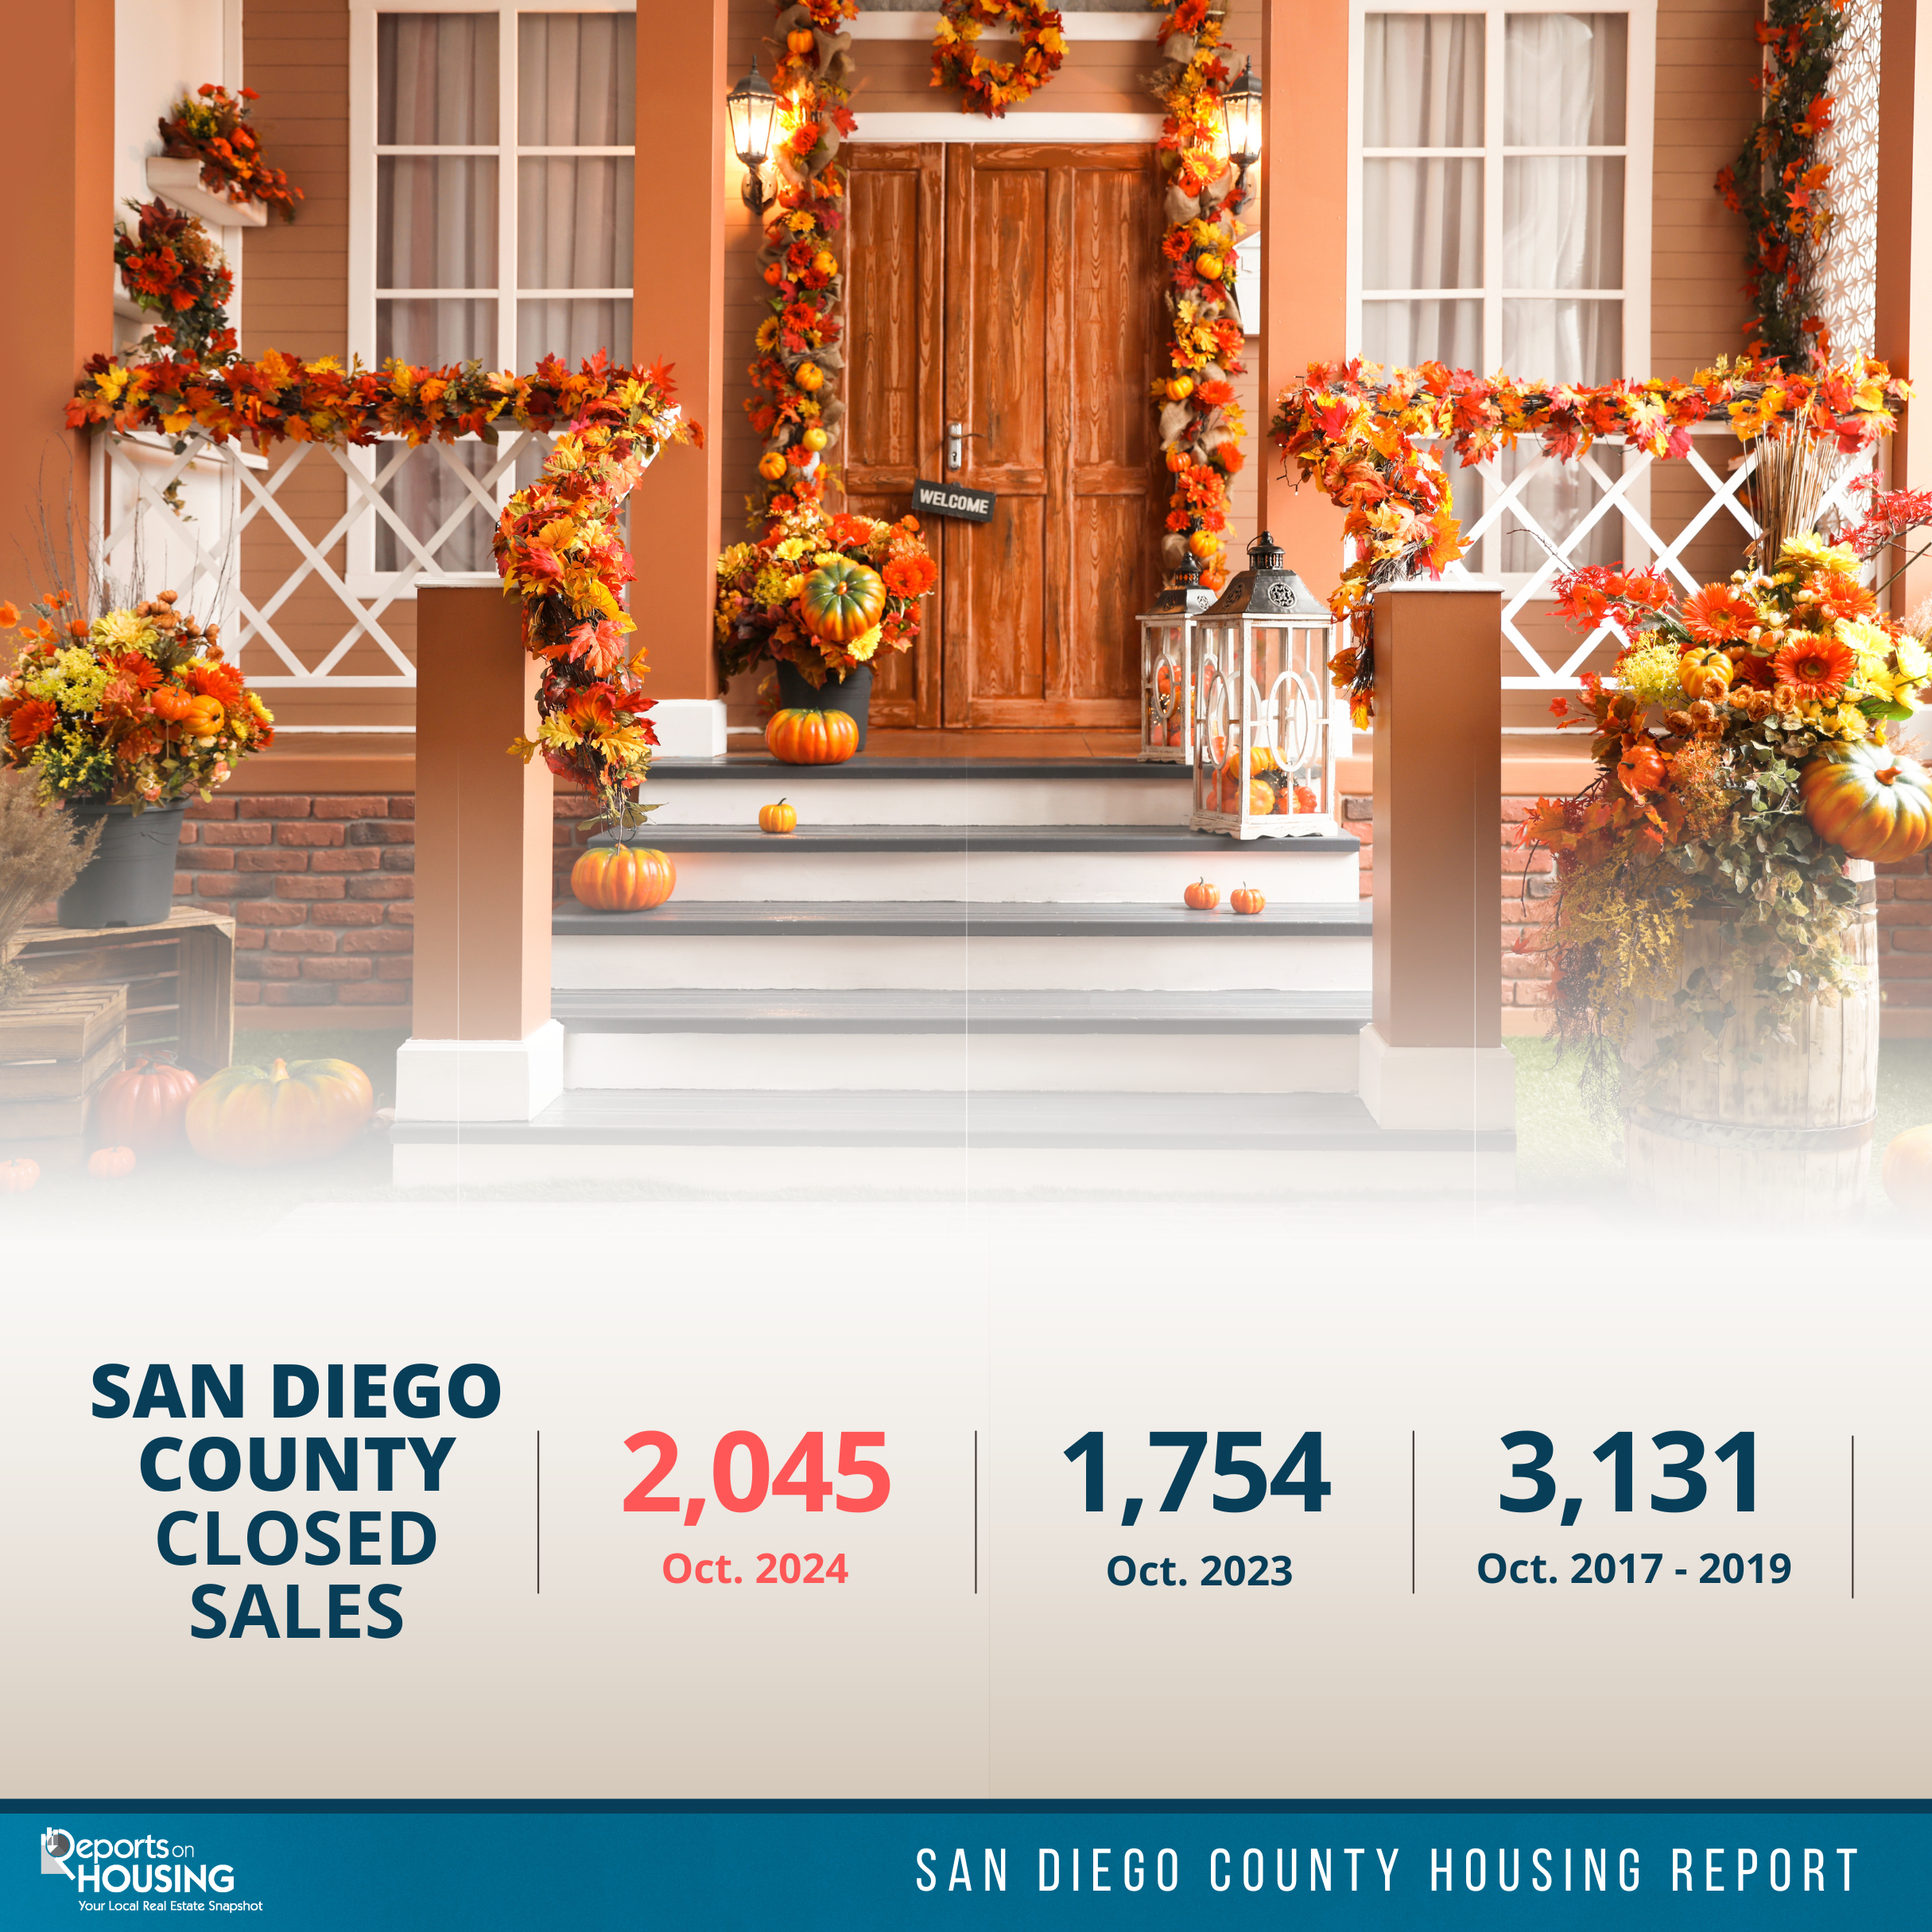
- There were 2,025 closed residential resales in October, up 16% from October 2023’s 1,753 closed sales. October marked a 10% increase compared to September 2024. The sales-to-list price ratio was 98.8% for all of San Diego County. Foreclosures accounted for only 0.15% of all closed sales, and short sales accounted for 0.05% of all closed sales. That means that 99.8% of all sales were good ol’ fashioned sellers with equity.
We would like to hear from you! If you have any questions, please do not hesitate to contact us. We are always looking forward to hearing from you! We will do our best to reply to you within 24 hours !

